Asian Mining Giants in Africa
A long-form scrollytelling investigation into how Chinese state-backed and hybrid enterprises came to dominate Africa's critical minerals supply chain — built to be read as a story and interrogated as a dataset.
Data Experience Design
We design interactive investigations, intelligence platforms, and visual stories for newsrooms, research institutions, and NGOs whose findings are too consequential to flatten into a chart.
Everything below was commissioned by one research organization: editorial scrollytelling, searchable intelligence platforms, live commodity tracking. Every product is public. Open the live build and judge the work directly.
A long-form scrollytelling investigation into how Chinese state-backed and hybrid enterprises came to dominate Africa's critical minerals supply chain — built to be read as a story and interrogated as a dataset.
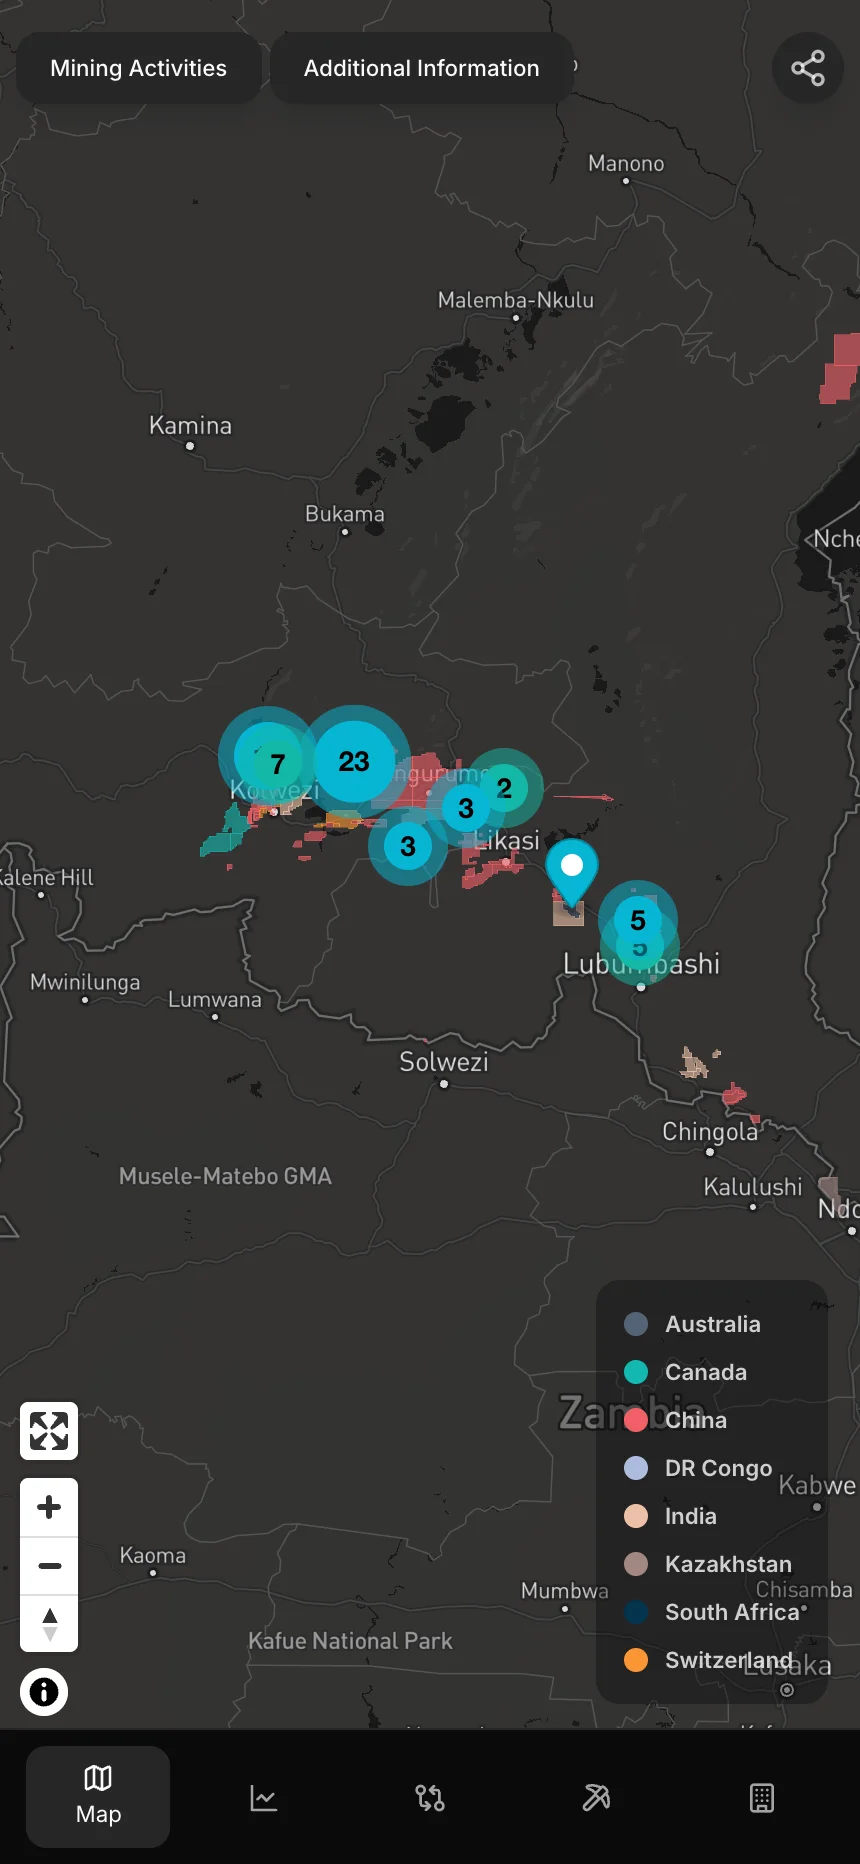
Chinese mining in Africa, resolved to the project level and made searchable.
Tracing where African cobalt and copper actually go
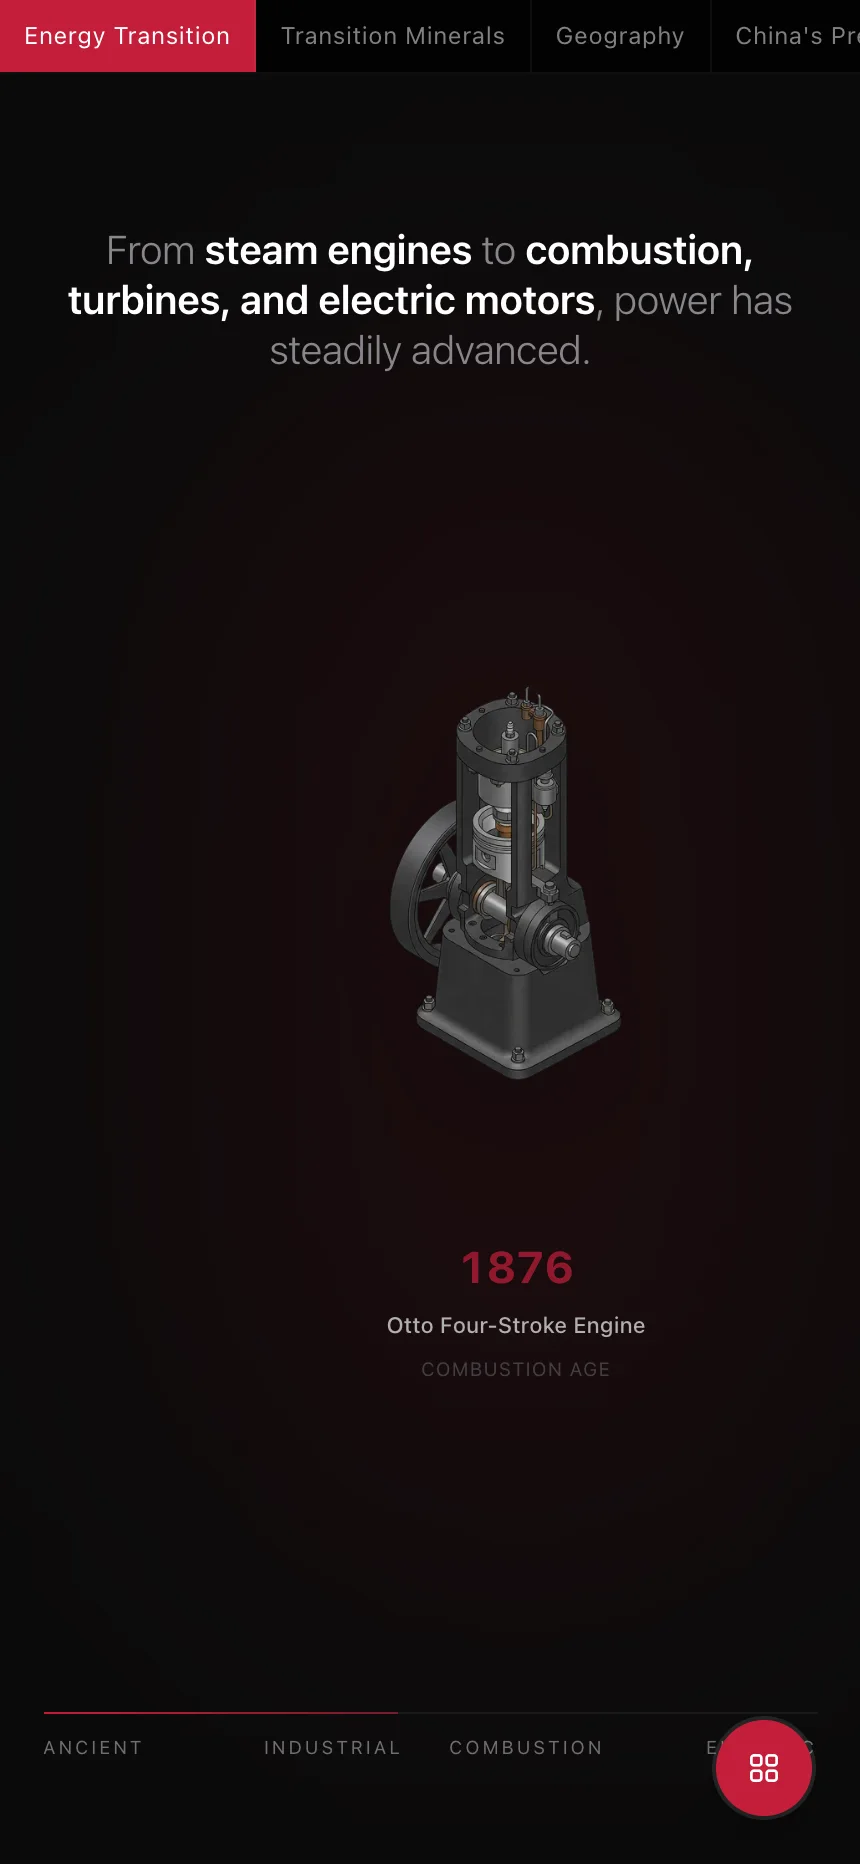
Africa isn't waiting for the electric car. It's redesigning it.
Three decades of Chinese security engagement in Africa, mapped in one place
A newsroom for the climate story Africa keeps having to explain itself
Indonesia mines the metal that powers the energy transition. This toolkit hands its journalists the questions no one is asking.
Four are live. Three are in production. All seven belong to the same partnership.
Anchor client
Our anchor client is an independent, non-partisan research and media organization tracking China's footprint across the developing world. One commission in, they asked for another. Seven products and four years later, we are the organization's primary digital product studio.
Shipped for one anchor client — 4 live, 3 in active development.
Across Africa and Southeast Asia, from the DRC to Indonesia.
The China–Africa Security Atlas — 12 themes, spanning 1991–2026.
English and Bahasa Indonesia — reimagined for context, not translated.
A five-chapter investigation, a searchable intelligence platform, and a broadcast explainer are different problems. We work in five disciplines — twenty-six delivery types between them — and every engagement begins by naming yours.
Data journalism, fully realized.
Project-based
Long-form interactive investigations that fuse editorial narrative with rich data visualization. Scroll-driven, kinetic, built to serve the generalist reader and the specialist analyst at once.
Complex data, built to explore.
Project-based
Focused data products that give an audience direct, hands-on access to a dataset. One dataset, one interaction model, one audience question — executed with depth and precision.
Research infrastructure for serious institutions.
Project-based
Structured, searchable platforms for sustained, high-frequency professional use — not one-time reads. Multiple user profiles served simultaneously without flattening the distinctions between them.
Data stories that move.
Project-based
Motion-based data communication for every platform that moves. Broadcast-quality output for video; performance-optimized for digital distribution.
Data made visible, everywhere it's read.
Project-based · Retainer
Standalone data communication design for print, digital publication, and the web — without the need for a full platform build. The one discipline that also runs as a retainer.
Three enhancement modules, added only when the work calls for them — never as an upsell.
M·01
CMS Integration
Your team. Your content. No dependency.
M·02
Interactive 3D
Spatial storytelling. In-browser.
M·03
AI Integration
Intelligent interfaces for complex information.
Discovery & Strategy opens every engagement, and it is never skipped. From there the work moves through four stages, and your project takes only what it calls for — the scope is explicit before any build begins.
Nothing runs by default — every engagement takes only the steps the work calls for.
Data auditing, audience research and persona mapping, editorial and narrative framing, UX strategy and information architecture — delivered as a fully documented creative brief before any design or development begins. Not an optional add-on; it is how every project gets built on the right foundation.
The data, the architecture, and the editorial strategy are settled before anything is designed.
Narrative structure, interface, and every visual asset — designed in service of the audience and the gravity of the material.
Engineering, mapping, motion, and module integrations — where architecture becomes a working product.
Instrumentation, testing, deployment, and delivery — then the ongoing partnership most engagements grow into.
Most data is either locked away from the people who need it, or flattened into charts nobody reads. VizStats exists to close that gap.
We began as a one-person practice and became a studio through the work itself. Today we serve investigative newsrooms, research institutions, policy organizations, and NGOs: the people for whom getting the data right is not optional.
We work with a small number of organizations each year and stay with the work as it grows.
Geopolitics, supply chains, security, climate, indigenous land rights — we understand the material, not just the brief.
Based in Port Harcourt, Nigeria; delivering to US, UK, European, African, and Southeast Asian audiences. Geography has never been the constraint.
We are not a volume studio, a generalist agency, or a dashboards-on-demand vendor.
We take on a limited number of organizations each year: the ones that treat data as evidence, not decoration. Our longest-standing client came for one product and stayed for seven.
We take on a limited number of engagements each year, and every inquiry is read and answered personally. We work with organizations that take their data seriously and want a partner who does the same.
One commission in, they asked for another. Seven products and four years later, we are the organization's primary digital product studio.
What happens next
Prefer email?
ubachi@vizstats.comSTEP 01 / 04